
Measure App KPIs
The Vega App Key Performance Indicator (KPI) Visualizer measures key performance metrics for your app. These metrics include launch times, memory usage, UI fluidity, video fluidity, and responsiveness. Use it to monitor and optimize your app's user experience. By regularly tracking these KPIs, you can verify that your app delivers a smooth, responsive experience. Before you publish your app to the App Store, measure the performance of the release variant.
Understanding fluidity and responsiveness:
- Responsiveness measures how quickly your app reacts when users interact with it. Users expect no noticeable delay between pressing a button and seeing the UI update.
- Fluidity (also called "smoothness") measures how smoothly animations, scrolling, and video playback render, free from stutters, jank, or dropped frames.
This page explains how to:
- Use the KPI Visualizer
- Measure and understand your app's key performance metrics
- Set up measurements
- Interpret results
Prerequisites
Before you use the Vega App KPI Visualizer:
-
Install the Vega Performance API module:
npm install @amazon-devices/kepler-performance-api -
Read the following sections:
- What each KPI measures and its target guidelines. See App KPI metrics and guidelines.
- How apps launch in different scenarios. See Launch scenarios.
- When to set performance markers. See Fully drawn marker.
-
To measure foreground memory, video fluidity, or UI fluidity, follow the instructions in Measure Fluidity and Foreground Memory.
-
Choose your measurement method:
App KPI metrics and guidelines
The following table presents both main KPIs and their associated Micro KPIs. Main KPIs measure overall performance metrics, while Micro KPIs represent specific measurable components that contribute to a main KPI.
For example, Application JavaScript bundle load time is a Micro KPI that contributes to the overall time-to-fully-drawn (TTFD) KPI. Empty Micro KPI cells indicate that no specific sub-components contribute to that main KPI.
| KPI | Micro KPI | Unit | Launch scenario | Description | Guideline |
|---|---|---|---|---|---|
Time-to-first-frame (TTFF) |
Seconds (s) | Cool start app launch | Measures the time from app launch to first frame render. The operating system (OS) calculates TTFF without requiring app code markers. | < 1.5 s. | |
TTFF |
Seconds (s) | Warm start app launch | Measures the time an app takes to move from background to foreground. The OS calculates TTFF without requiring app code markers. | < 0.5 s. | |
TTFD |
Seconds (s) | Cool start app launch | Measures the time from launch until the app is ready for user interaction. You must determine when your app is fully drawn. See Fully drawn marker. | < 8.0 s. | |
TTFD |
Application JavaScript bundle load time |
Seconds (s) | Cool start app launch | Measures the time for the JavaScript bundle to load during app initialization. | N/A |
TTFD |
Network calls time |
Seconds (s) | Cool start app launch | Measures the time for all network calls to complete during app initialization. This measurement accounts for parallel requests. It represents the total duration until all calls resolve. | N/A |
TTFD |
Seconds (s) | Warm start app launch | Measures the time for an app to become fully interactive after moving from background to foreground. You must invoke the fully drawn callback when the app state changes to foreground. See Fully drawn marker. | < 1.5 s. | |
Foreground Memory |
MebiBytes (MiB) | App in foreground | Measures the app's Proportional Set Size (PSS) when active. PSS reflects the private memory and the proportional share of shared memory held in RAM. The Vega App KPI Visualizer measures this metric during launch, foreground transition, and memory-intensive actions. | < 400 MiB. | |
Background Memory |
MebiBytes (MiB) | App in background | Measures the app's PSS after launching and moving to the background. This metric captures the memory footprint when the app is inactive but ready for quick resumption. | < 150 MiB. | |
Video Fluidity |
Percent (%) | Video playback | Measures the percentage of time video plays at its intended frame rate. Higher values indicate smoother playback. | > 99%. | |
Time-to-First Video Frame (TTFVF) |
Milliseconds (ms) | Video playback | Measures the time from video playback start to first video frame. The last UI interaction in prep member triggers video streaming. See Measure Fluidity and Foreground Memory for details. |
< 2500 ms. | |
TTFVF |
Time to player start | Milliseconds (ms) | Video playback | Measures the time to create the media player instance. Available only for Vega Media Player in VegaScript projects. | < 2500 ms. |
TTFVF |
Player start to first video frame | Milliseconds (ms) | Video playback | Measures the time for the first video frame to appear after media player instance creation. Available only for Vega Media Player in VegaScript projects. | < 2500 ms. |
3+ Video Consecutive Dropped Frames |
Count | Video playback | Counts instances where the app drops three or more video frames in a row during playback, causing noticeable interruptions in video streaming quality. | N/A | |
5+ Video Consecutive Dropped Frames |
Count | Video playback | Counts the instances where the app drops five or more consecutive frames during video playback, indicating significant playback disruptions. | N/A | |
Key pressed latency |
Milliseconds (ms) | Video playback | Measures the time from a key press input event on the UI thread to its JavaScript callback invocation. | < 100 ms. | |
Key released latency |
Milliseconds (ms) | Video playback | Measures the time from a key release input event to its corresponding JavaScript callback invocation. | < 100 ms. | |
UI Fluidity |
Percent (%) | UI interaction (for example, vertical and horizontal scrolling) | Measures the percentage of frames the app successfully renders during on-screen UI interactions like scrolling and navigation. | > 99%. | |
App Event Response Time - Focus |
Milliseconds (ms) | UI interaction (for example, vertical and horizontal scrolling) | Measures the scheduling latency between the native UI thread and JavaScript thread for focus events (onFocus/onBlur). Delays over 200 ms indicate JavaScript thread congestion. | < 200 ms. | |
3+ Consecutive Dropped Frames |
Count | UI interaction (for example, vertical and horizontal scrolling) | Counts the instances where the app drops three or more consecutive frames during scrolling, causing noticeable stuttering in the user interface. | N/A | |
5+ Consecutive Dropped Frames |
Count | UI interaction (for example, vertical and horizontal scrolling) | Counts the instances where the app drops five or more consecutive frames during scrolling, causing significant stuttering in the user interface. | N/A | |
5+ Consecutive Delayed Events - Focus |
Count | UI interaction (for example, vertical and horizontal scrolling) | Counts the instances where the app experiences five or more consecutive delayed focus events, causing significant delay in navigation responsiveness. | N/A |
Launch scenarios
The KPI Visualizer measures two types of app launch scenarios to evaluate performance for TTFF and TTFD:
-
Cool start - When a user launches an app for the first time, and the system loads all resources and dependencies into memory.
-
Warm start - When a user moves an app from background (an inactive state) to foreground (an active state) with some resources and dependencies already in memory.
Fully drawn marker
A fully drawn marker signals when your app becomes interactive for users. The marker:
- Indicates when your app completes loading its essential components.
- Marks when users can start interacting with your app.
- Helps measure TTFD performance.
To implement a fully drawn marker in your app:
- Add the
useReportFullyDrawnhook to your app. - Place markers at these key points:
- Cool start - After loading initial data and rendering the main screen.
- Warm start - When your app becomes responsive after foregrounding.
The following code sample shows how to add a fully drawn marker:
import { useReportFullyDrawn } from '@amazon-devices/kepler-performance-api';
import React, { useCallback, useEffect, useState } from 'react';
import { useKeplerAppStateManager } from '@amazon-devices/react-native-kepler';
...
...
export const App = () => {
  const reportFullyDrawnCallback = useReportFullyDrawn();
  const KeplerAppStateManager = useKeplerAppStateManager();
  const [appState, setAppState] = useState(KeplerAppStateManager.getCurrentState());

  // Using a useEffect Hook to have the fully drawn reporting performed
  // post first render after cool launch.

  // If the app performs additional asynchronous processing
  // that needs to be completed before it is fully drawn, pass the
  // completion state in the array of dependencies and check the state
  // inside the hook.
  useEffect(() => {
    reportFullyDrawnCallback();
  }, [reportFullyDrawnCallback]);

  // Emit fully drawn marker on the first draw after warm launch.
  const handleAppStateChange = useCallback((stateChange: any) => {
    if (

	 appState.match(/^(inactive|background)$/) &&
	 stateChange === 'active'
	) {
	  reportFullyDrawnCallback();
	}
	if (stateChange.match(/^(inactive|background|active|unknown)$/)) {
	  setAppState(stateChange)
	}
  }, [appState, reportFullyDrawnCallback]);

  useEffect(() => {
    const changeSubscription = KeplerAppStateManager.addAppStateListener(
	  'change',
	  handleAppStateChange,
    );
    return () => {
	  changeSubscription.remove();
	}
  }, [handleAppStateChange]);
  ...
  ...
  return (
    <View style={styles.container}>
      ...
      ...
    </View>
  );
};
Measure KPIs in VS Code
Step 1: Open the command palette in VS Code
- For Mac: Shift+Command ⌘+P
- For Linux: Ctrl+Shift+P

Step 2: Enter Vega: Launch App KPI Visualizer
Step 3: Press Enter

You can also choose the App KPI Visualizer from the Vega Studio panel.
Step 4: Choose a use case

To measure foreground memory and video streaming fluidity, create a custom test scenario that matches how your users interact with your app.
For example:
- For memory testing - Include video playback or image loading.
- For streaming - Include typical video watching patterns.
For UI fluidity measurement, develop a test scenario that replicates the most common user interactions in your app. Without a custom scenario, the default test scrolls through your app's front page. This might not accurately represent your users' behavior.
For guidance on generating test scenarios, see Measure Fluidity and Foreground Memory.
After you choose your use cases, the visualizer starts and performs three iterations for the following KPIs.
Cool start KPIs
- Launch the test app on the device.
- Wait 10 seconds for the test app to load.
- Close the test app.
- Process the KPIs.
Warm start KPIs
- Launch the test app on the device.
- Launch another app on the device, moving the test app to the background.
- Launch the test app, moving it to foreground.
- Wait 15 seconds for the test app to load.
- Close the test app.
- Process the KPIs.
Foreground memory KPIs
- Launch the test app on the device.
- Perform the specified steps in the test scenario.
- Capture the KPIs for analysis and reporting.
- Close the test app.
- Process the KPIs.
Background memory KPIs
- Launch the test app on the device.
- Launch another app on the device, moving the test app to the background.
- Wait 15 seconds to collect the test app's KPIs.
- Close the test app.
- Process the KPIs.
UI fluidity KPIs
- Launch the test app on the device.
- Choose your test method:
- Custom test - Use your own UI interaction scenarios
- Default test - Uses standard scrolling patterns
- Two sets of horizontal scrolls (five left, five right)
- Two sets of vertical scrolls (five down, five up)
- 900 ms between actions
-
Choose Cancel or press Esc to end the test.

- Capture the KPIs for analysis and reporting.
- Close the test app.
- Process the KPIs.

The predefined test scrolls through your app's home page, which might not represent your app's usage pattern. Create a custom test scenario that reflects your app's specific UI interactions.
Video playback fluidity KPIs
- Launch the test app on the device.
- Perform the steps in the video playback test scenario.
- Capture the KPIs for analysis and reporting.
- Close the test app.
- Process the KPIs.
To stop the visualization process, choose Cancel.

Step 5: Choose whether to ignore trace loss during the test

When your app has performance issues, significant trace loss can occur. The Vega App KPI Visualizer doesn't load traces and shows KPIs as N/A in the report.
You can choose to ignore trace losses when generating KPI reports to view the metrics. However, ignoring trace losses produces KPI values that appear better than actual performance.
Step 6: View KPI scores in the visualizer window
The window shows the P90 (90th percentile) value calculated from three test iterations.
Step 7: Assess results
To assess the results, see Understand the performance report.
Measure KPIs with CLI commands
Step 1: Check device readiness
At the command prompt, run the vega exec perf doctor command to check if your host and target devices are ready.
vega exec perf doctor [--app-name]
Replace --app-name with the package ID from the manifest.toml file. When multiple devices are running, specify the device serial number. Use the --device-serial-number parameter in the perf commands.
Example if only a single device is connected:
# Single device
vega exec perf doctor --app-name=com.amazondeveloper.keplervideoapp.main

Firmware: Stable build (<device-user> OS 1.1 (TV Mainline/1387)).
✅ Network: Connected
✅ Free disk space: 43.31 GB available.
✅ Appium: Installed (version 2.2.2)
✅ Appium driver for Vega: Installed - kepler@3.18.0 [installed (linked from /Users/.../AppiumVegaDriver)]
✅ com.amazondeveloper.keplervideoapp.main is installed.

Collecting CPU (4 cores) and Memory data...
❌ Max User CPU usage at 241.20%. Check for unwanted processes.
❌ Max System CPU usage at 222.80%. Check for unwanted processes.
✅ Average User CPU usage at 166.16%
✅ Average System CPU usage at 101.84%
✅ Min memory available at 30.80%
✅ Average memory available at 32.16%

! Device: Not ready for performance testing. Please review lines with X (error) and ! (warnings) symbols.
Example if multiple devices are connected:
# Multiple devices
vega exec perf doctor --app-name=com.amazondeveloper.keplervideoapp.main --device-serial-number=G000XX1234567890
Step 2: Start the Vega App KPI Visualizer
vega exec perf kpi-visualizer --app-name=[app-name]
For kpi-visualizer, app-name is the only required parameter. Replace [app-name] with the ID of the default interactive component from the manifest.toml file.
Step 3: (Optional) Specify the number of iterations
Default iterations: three, or 30 if --certification is used.
--iteration [number]
Step 4: (Optional) Specify which KPI to measure
--kpi [kpi name]
Without this parameter, the visualizer measures cool start TTFF and TTFD KPIs by default.
Step 5: View all available options
kpi-visualizer --help
Example:
vega exec perf kpi-visualizer --help

    NAME:

    KPI Visualizer Tool

    DESCRIPTION:

    Measures key performance metrics like app launch times, memory usage, and UI responsiveness to optimize your app's user experience.

    SYNOPSIS:

    vega exec perf kpi-visualizer [parameters]

    Use 'vega exec perf command --help' to retrieve information for a specific command.

    PARAMETERS:

    --iterations ITERATIONS
          Sets the number of times to run the test. This overrides .conf setting.
    --record-cpu-profiling
          Enables CPU profile recording during test execution.
    --sourcemap-file-path SOURCEMAP_FILE_PATH
          Specifies the path to the source map file.
    --grpc-port port
          Specifies the port number for the gRPC server.
    --certification
          Runs tests in certification mode using 30 iterations and 90th percentile aggregation.
    --expected-video-fps EXPECTED_VIDEO_FPS
          Specifies the target FPS for the app under test.
    --kpi KPI
          (Optional) Specifies the performance metric to measure.

          Supported scenarios:
          1. cool-start-latency -  Measures app launch latency from cold start. Includes both TTFF and TTFD by default.
          2. ui-fluidity - Measures smoothness of UI interactions.
          3. warm-start-latency - Measures first frame display latency when resuming an app from background to foreground.
          4. foreground-memory -  Measures app memory usage while in foreground state.
          5. background-memory -  Measures app memory usage while in background state.
          6. video-fluidity - Measures smoothness of video playback. Requires a test scenario (--test-scenario) that initiates video playback.

    --test-scenario TEST_SCENARIO
          Specifies the Python script that defines the UI test scenario. Use the generate-test-template command to create a test scenario template.

    --monitor-processes MONITOR_PROCESSES [MONITOR_PROCESSES ...]
          Specifies additional services to monitor during testing.

          Example:
          --monitor-processes webview.renderer_service

    --ignore-trace-loss
          Skips trace data loss verification during test.

    --help
          Shows this help message.

    --version, -v
          Shows current version of this perf tool.
    %
After the visualization completes, you see a report summary in stdout.
Example report:
Performance Analyzer KPI Report

Firmware version: Device OS 1.1 (VegaMainlineTvIntegration/XXXX), serial number: XXXXXXXXXXXXXXXX
Date: 01/09/2025, test: app-background, iterations requested: 3, iterations completed: 3, duration: 15 seconds

Memory Statistics
                            | n   | min    | mean    | max    | stdev  | ci (+/-)
App Resident Memory (kB)    | 104 | 131044 | 132139.0| 133136 | 865.2  | 140.8 √
When KPIs show -1, it indicates unavailable data for mean, min, and max values. For TTFD, this might occur when the app doesn't call the Report Fully Drawn API.
When KPIs don't appear, there might be a significant trace loss during data collection. The KPI Visualizer doesn't load traces and doesn't show KPIs. To view KPIs despite trace loss, run:
--ignore-trace-loss <true/false>
Understand the performance report
The Vega App KPI Visualizer shows a performance report, which includes:
-
Test information
- Date - The date when the system captures the KPI data.
- Device Serial ID - The unique identifier of the device running the app.
- App - The name of the app for which the KPI data appears.
- Number of iterations - The number of times the KPI measurement process runs.
-
KPI Name - The name of the KPI with its unit.
-
Test Name - The name of the test or the completed use case.
-
KPI Health - A color-coded system representing the health of each KPI:
- 🟢 (Green) - Meets the recommended guideline.
- 🟡 (Yellow) - Within 10% of the guideline.
- 🔴 (Red) - Exceeds the guideline by more than 10%.
-
KPI Score - The numeric value of the KPI, which appears in the same unit as specified in the KPI name. If the visualizer can’t calculate the KPIs, it displays "N/A" for the KPI score and lists the KPI Health as "Unknown."
-
Guideline - The recommended value or range for the KPI score based on industry standards or performance targets.
Example results
The following images show sample results for each use case. Pay attention to the KPI Health indicators and scores relative to guidelines.
Use case: cool start TTFF and TTFD
The following results show launch performance metrics. Red indicators show the app exceeds the launch time guidelines.

Use case: warm start TTFF and TTFD
The following results show how your app resumes from background state. Compare TTFF and TTFD times to evaluate optimization needs.

Use case: foreground memory
The following results show your app's memory usage during active use. Monitor this metric to prevent performance issues from excessive memory consumption.

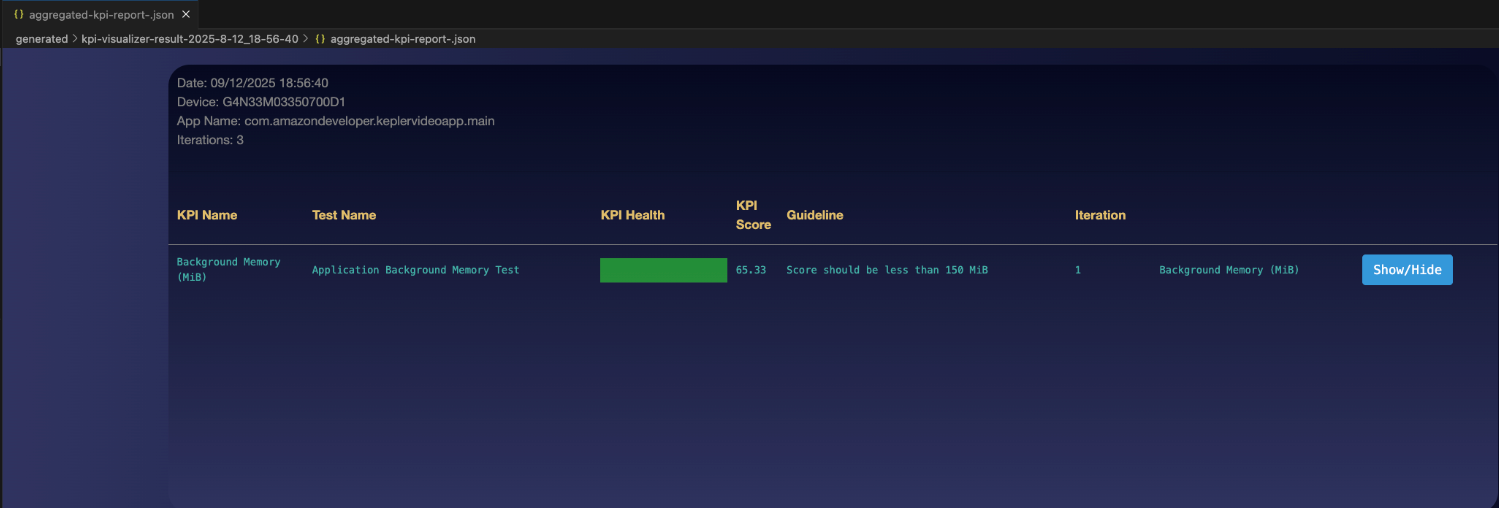
Use case: background memory
The following results show your app's memory footprint while in background state. Understanding your app's impact on system resources when inactive helps optimize background behavior.
Use case: UI fluidity
The following results show how smoothly your app handles user interactions. The percentage indicates frames successfully rendered during scrolling and navigation.

Use case: video playback fluidity
The following results show how smoothly your app plays video content. The percentage represents successful frame delivery at the intended playback rate. This scenario also includes media player and input event micro KPIs.

Open a KPI report
After the Vega App KPI Visualizer completes the test scenarios, it generates the following report files:
-
aggregated-kpi-report-[timestamp].json - Consolidates KPI data from all test scenarios.
-
[test-name]-kpi-report-[timestamp].json - Creates one file for each individual test scenario. The [test-name] identifies the specific scenario.
The [timestamp] tells you when the Vega App KPI Visualizer generated the report.
To open a KPI report, open a previous recording. Then use one of these methods:
Option 1 (Preferred): Use Quick Open
This method provides access to your recordings through VS Code's interface or CLI.
From VS Code
-
Find the KPI report file (example:
app-launch-kpi-report-[timestamp].json) using VS Code Quick Open or in the project'sgenerateddirectory. -
Choose the file once to preview or twice to open in active mode.
From the CLI
-
Open a terminal window and enter:
code <<path-to-recording-file>>If your terminal doesn't recognize the
codecommand, open the VS Code command palette (Cmd+Shift+P on Mac, Ctrl+Shift+P on Linux). - Select Shell Command: Install code command in PATH.
- Retry the command.
Option 2: Use the VS Code Command Palette
This method provides access to your recording using VS Code's built-in command interface or if Quick Open isn't available.
- Open VS Code.
- Open the command palette (Cmd+Shift+P on Mac, Ctrl+Shift+P on Linux).
- Enter Vega: Open Recording View.
- Choose the file you want to open, such as
app-launch-kpi-report-[timestamp].json.
Related topics
- Improve App Performance on Vega
- Measure Fluidity and Foreground Memory
- Inspect Traces
- Set Up Amazon Devices Builder Tools for AI-Powered Development
Last updated: May 06, 2026