
监控CPU使用情况
CPU使用情况直接影响应用的性能和用户体验。为了帮助您跟踪和优化CPU消耗,Vega Studio提供了以下监控工具:
- Activity Monitor(活动监视器)- 提供实时CPU指标和记录功能(仅限Fire TV Stick)。
- Recording View(记录试图)- 启用筛选数据分析和生命周期事件跟踪。
使用这些工具来发现性能瓶颈,并在CPU密集型问题影响用户之前将其解决。
先决条件
确保您已:
- 拥有一个可以运行的应用。有关构建应用的说明,请参阅构建您的应用。
- 在设备上连接应用。
启动Activity Monitor
- 在已连接的设备上启动应用。
-
在Visual Studio Code (VS Code) 中,打开命令面板。
Mac:
Shift+Command ⌘+PLinux:
Ctrl+Shift+P
-
输入Vega: Start Activity Monitor,然后若是Mac则按return键,若是Linux则按回车键。
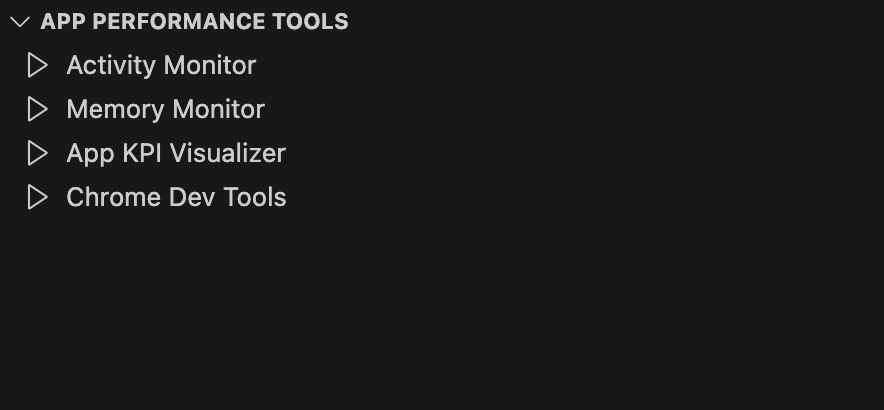
您也可以从App Performance Tools中选择Activity Monitor。
您先会看见一个进度条,然后会看到Activity Monitor在新窗口中打开。

-
如果您没有看到进度条,请关闭窗口并重新启动Activity Monitor。
-
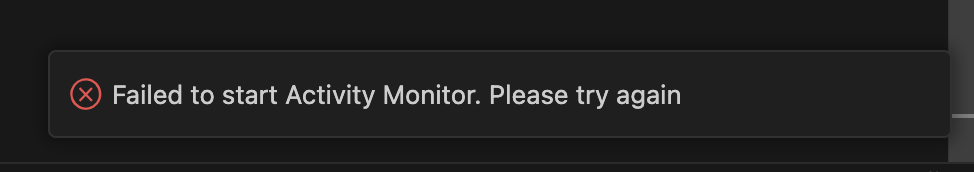
如果发生错误,您将看到以下消息:

-
关闭消息,然后重新启动Activity Monitor。
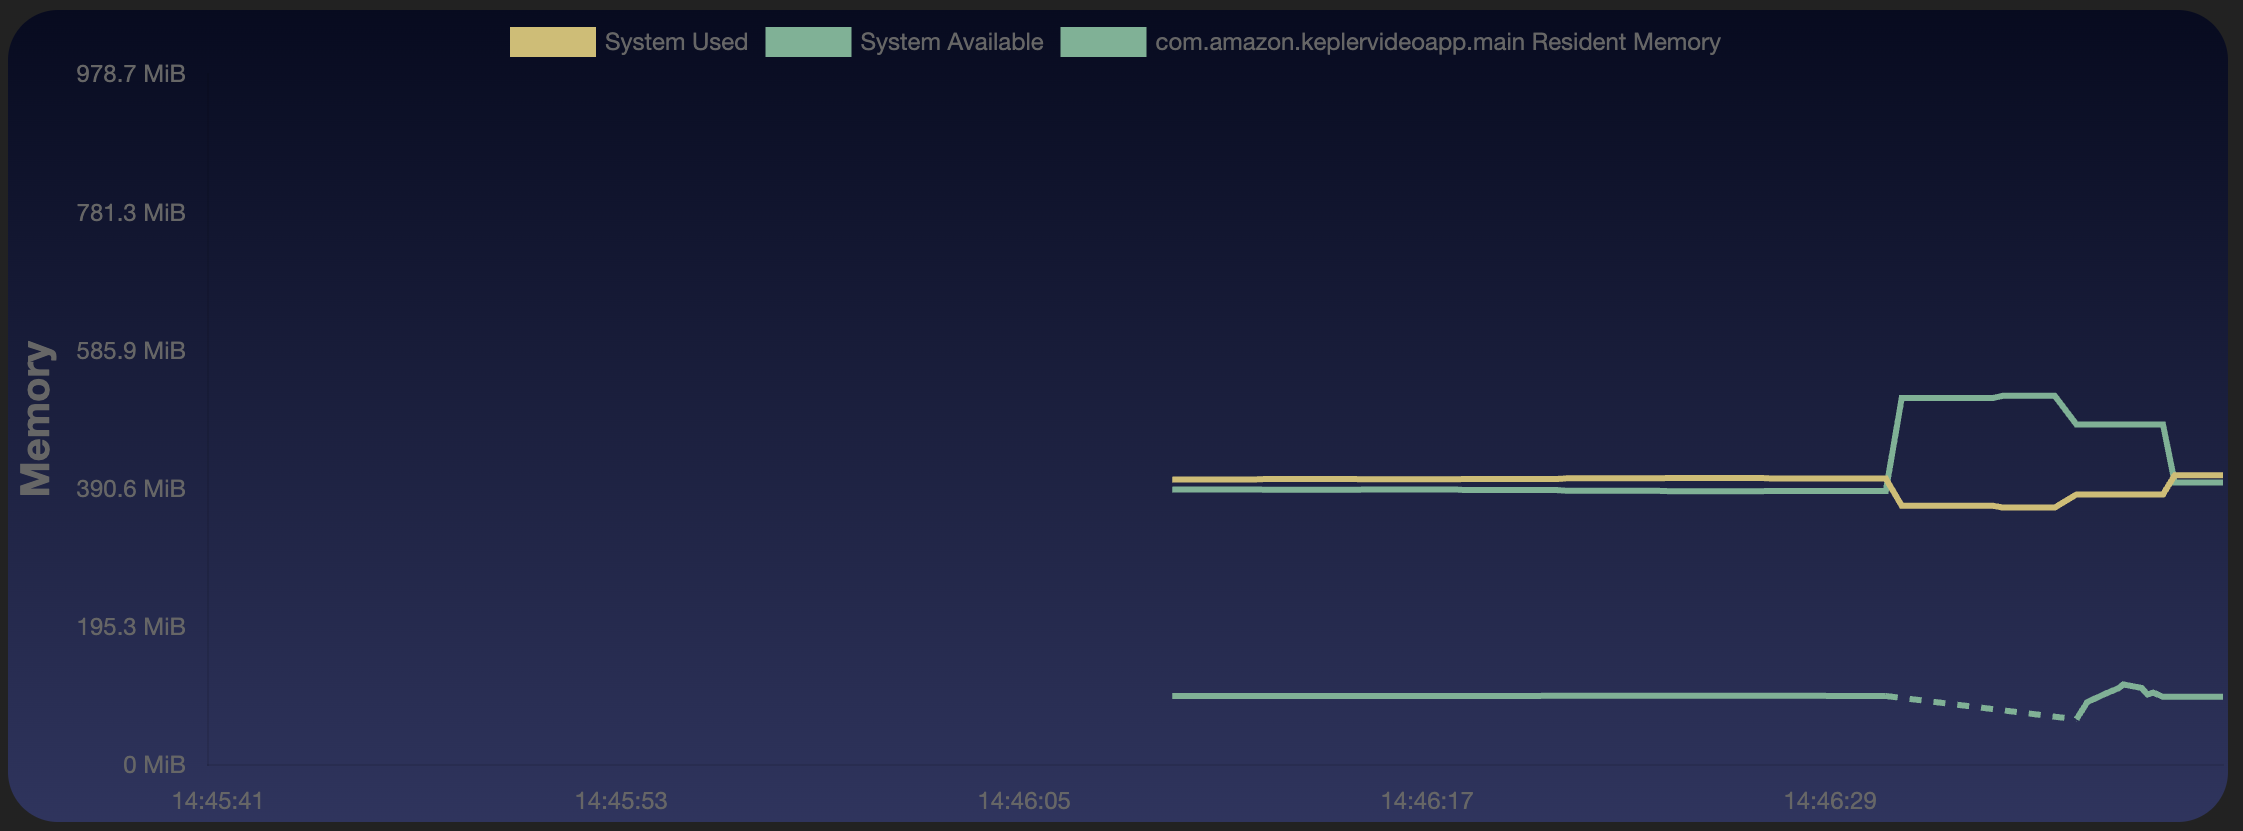
Activity Monitor会显示两个时间序列图表:
- CPU利用率
- 内存使用情况
在这两个图表中,x轴代表一个连续的时间窗口,使得不同数据流中的活动能够相互关联。

CPU利用率图表的y轴显示设备上所有核心在一段时间内的实时CPU使用情况。
注意: 400%的CPU利用率表示四个内核的使用量已满。
内存图表的y轴显示一段时间内以兆字节 (MiB) 为单位的当前内存消耗量。
注意: 将Activity Monitor与Vega虚拟遥控器播放器 (VVRP) 一起使用时,只有系统内存可用。未显示应用内存。性能图表中的虚线反映的是应用在崩溃和重启之间的停机时间,表示仅在应用运行时记录数据。如果应用崩溃,Activity Monitor将停止收集数据。重新启动应用以恢复监控。

-
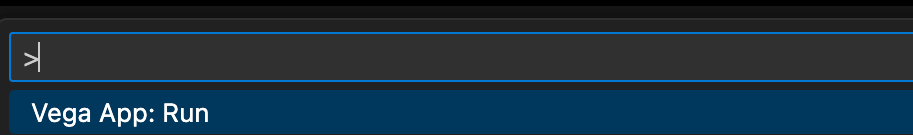
在命令面板中输入Vega App: Run。
您也可以导航到Vega Studio > Projects(项目)部分。然后会连同构建、向上箭头和播放图标显示您的应用名称。
- 选择播放图标。


开始录制
- 在Activity Monitor中,选择⏺️ Start Recording(开始记录)。
- 出现提示时,输入记录会话的名称。
- 出现提示时输入记录超时时间。默认情况下,记录超时时间为120秒。
- 在您的Fire TV Stick上,在“release”(发布)模式下运行您的应用。
-
选择⏹️ Stop Recording(停止记录)以结束会话。
Recording View将在单独的窗口中打开。
运行启动模式记录
此功能可在应用启动期间捕获CPU、内存消耗、跟踪和CPU分析器数据。使用这些数据来确定经过优化后可以缩短启动时间的函数。在使用此功能之前,请确保您的应用项目中存在react-native.config.js文件,其中包含了project和kepler:
module.exports = {
   project: {
      kepler: {
      }
   },
};
- 将您的Vega设备连接到开发计算机。
-
在Vega设备上运行您的应用。
按照在Fire TV Stick上运行您的应用中的步骤操作。
-
在Vega Studio面板中:
- 从Build Modes(构建模式)中选择
Release(发布)。 - 从Devices(设备)中选择要连接的设备。
- 从Build Modes(构建模式)中选择
-
打开命令面板:
Mac:
Shift+Command ⌘+PLinux:
Ctrl+Shift+P
-
输入Vega: Run CPU Profiler on App Launch,然后若是Mac则按return键,若是Linux则按Enter键。
在配置、构建、安装、记录和应用启动期间,屏幕会显示进度通知。
该进程完成后,Vega会按照启动模式分析的配置生成应用
vpkg(适用于应用分发的Vega程序包格式)。然后将这个程序包安装在设备上。安装后,Activity Monitor将在新窗口中打开并开始记录分析数据。

结束记录会话
在Activity Monitor窗口中,选择Stop Recording。

Recording View将在单独的窗口中打开。
重新运行启动模式记录
-
输入Vega: Start Activity Recording and Launch App,以使用相同的应用程序重新运行启动模式记录。
-
如果您更改了应用代码,请在命令面板中输入以下命令以重新运行启动模式记录:Vega: Run CPU Profiler on App Launch。
分析您记录的数据
您可以在Recording View中分析记录的数据,包括时间线、CPU百分比、内存、跟踪和基于时间的火焰图。

时间线
“时间线”让您可以根据所选的时间窗口筛选数据。

- 使用鼠标拖动绿色时间线条可选择时间窗口。
- 筛选单个图表,例如: 分析器图表和CPU图表。在单个图表中所选的时间窗口仅影响所选图表。
跟踪
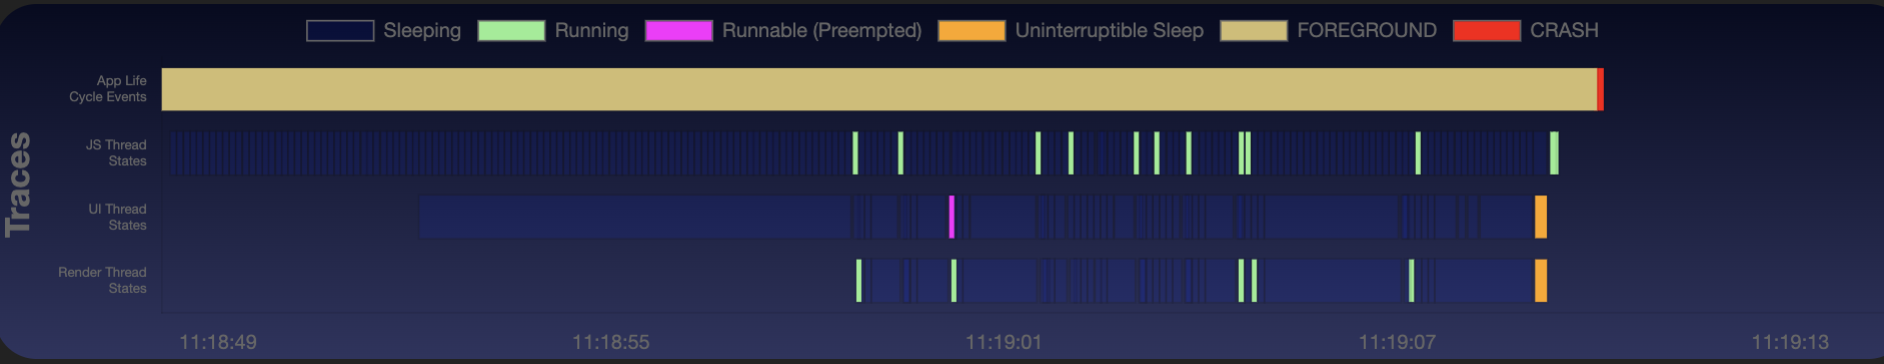
应用生命周期事件
应用生命周期提供有关应用状态的上下文,例如:
- Launch(启动)- 应用启动并在屏幕上变得可见时移至前台。
- Foreground(前台)- 应用在屏幕上可见。
- Background(后台)- 应用在屏幕上不可见,但正在后台运行。
- Crash(崩溃)- 该事件表示的是应用崩溃。
如果应用在受监控期间发生崩溃,Activity Monitor会执行以下操作:
- 为崩溃的应用下载相应的汇总崩溃报告 (ACR)。ACR包含有关崩溃的详细信息,这有助于诊断和修复问题。
- 向VS Code工作区发送通知,通知会显示在VS Code窗口的右下角。该通知包括两个操作按键: 对ACR进行符号化并查看和复制日志。
线程状态信息
线程状态信息会显示以下内容:
- 线程在每100毫秒间隔的主要状态。
- 线程在整个记录会话中耗费最多时间的位置。
线程类型
以下是各种线程类型:
- JS Thread(JS线程)- 在单个线程上运行所有JavaScript逻辑、事件处理程序和脚本。长时间运行的操作会阻止用户界面和渲染任务,从而导致性能问题,例如: 用户界面无响应、动画延迟、高延迟
- UI Thread(用户界面线程)- 更新界面元素并处理用户交互,例如单击和按键。阻止此关键线程会使您的应用无法响应。
-
Render Thread(呈现线程)- 创建和管理所有视觉元素,可与用户界面线程一起提供图形输出。
使用线程状态信息查找JavaScript应用存在的性能瓶颈。请参阅调查JavaScript线程性能中的常见场景。
线程状态
以下是各种线程状态:
- Running(正在运行)- 线程在CPU核心上活跃地执行指令。
- Runnable(可运行)- 线程已准备好运行,正在等待CPU核心调用。
- Runnable (Pre-empted)(可运行 [被抢占])- 调度程序抢占了一个线程以允许另一个线程运行,这表明CPU处于争用状态。
- Sleeping(休眠)- 线程自愿交出控制权,让其他线程可以使用CPU来帮助管理资源。
- Uninterruptible Sleep(不间断休眠)- 线程执行内核系统调用,不能接受抢占。
- Stopped(已停止)- 线程暂停(通常出于调试或同步原因),稍后可以恢复。
- Idle(空闲)- 线程等待工作分配,不会执行任何任务。
- Exit(退出)- 线程完成执行并终止,无法恢复。
常用函数
在记录过程中,常用函数会显示代码的哪些部分占用的CPU时间最长,包括用于子函数的时间(非独占时间)。
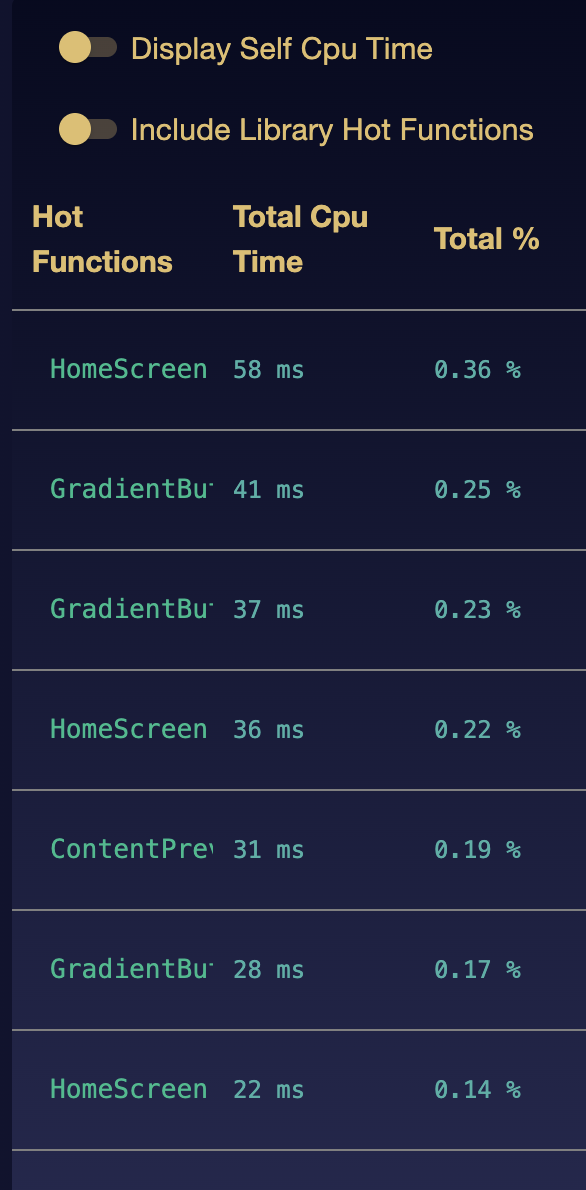
Recording View会显示常用函数表:
-
Hot Functions(常用函数)- 函数名称和源位置。选择
Hot Functions链接,导航到函数源代码。 -
Total CPU Time(总计CPU时间)- 整个记录会话中函数执行所花费的总时间(非独占),以毫秒 (ms) 为单位。
-
Self CPU Time(自身CPU时间)- 整个记录会话中函数执行所花费的总时间(独占),以毫秒 (ms) 为单位。
-
Total %(总计百分比)- 在此函数中花费的时间占总CPU时间的百分比(非独占)。

默认情况下,只有应用中的常用函数显示在常用函数表中。要查看来自第三方库的常用函数,请切换Include Library Hot Functions(包含库常用函数)选项。
@amzn/,可能无法检查某些库函数。要进行检查,请改用node_modules文件夹中相应的@amazon-devices/基于范围的路径。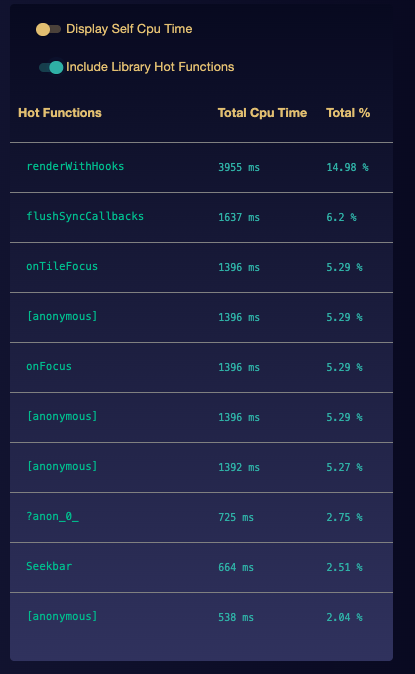
在记录会话期间,Vega CPU分析器每5-15毫秒对应用的性能进行一次采样。该分析器会完成以下任务:
- 在记录期间连接到您的应用
- 分析性能数据
-
创建两个文件:
- 包含常用函数摘要的JSON文件
- 包含跟踪事件格式(仅提供英文版)跟踪事件的CPU分析器 (traceEventsFilePath),适用于Chrome DevTools
分析可以帮助您:
- 确定您的代码库中CPU使用率最高的领域
- 优先考虑哪些函数需要优化
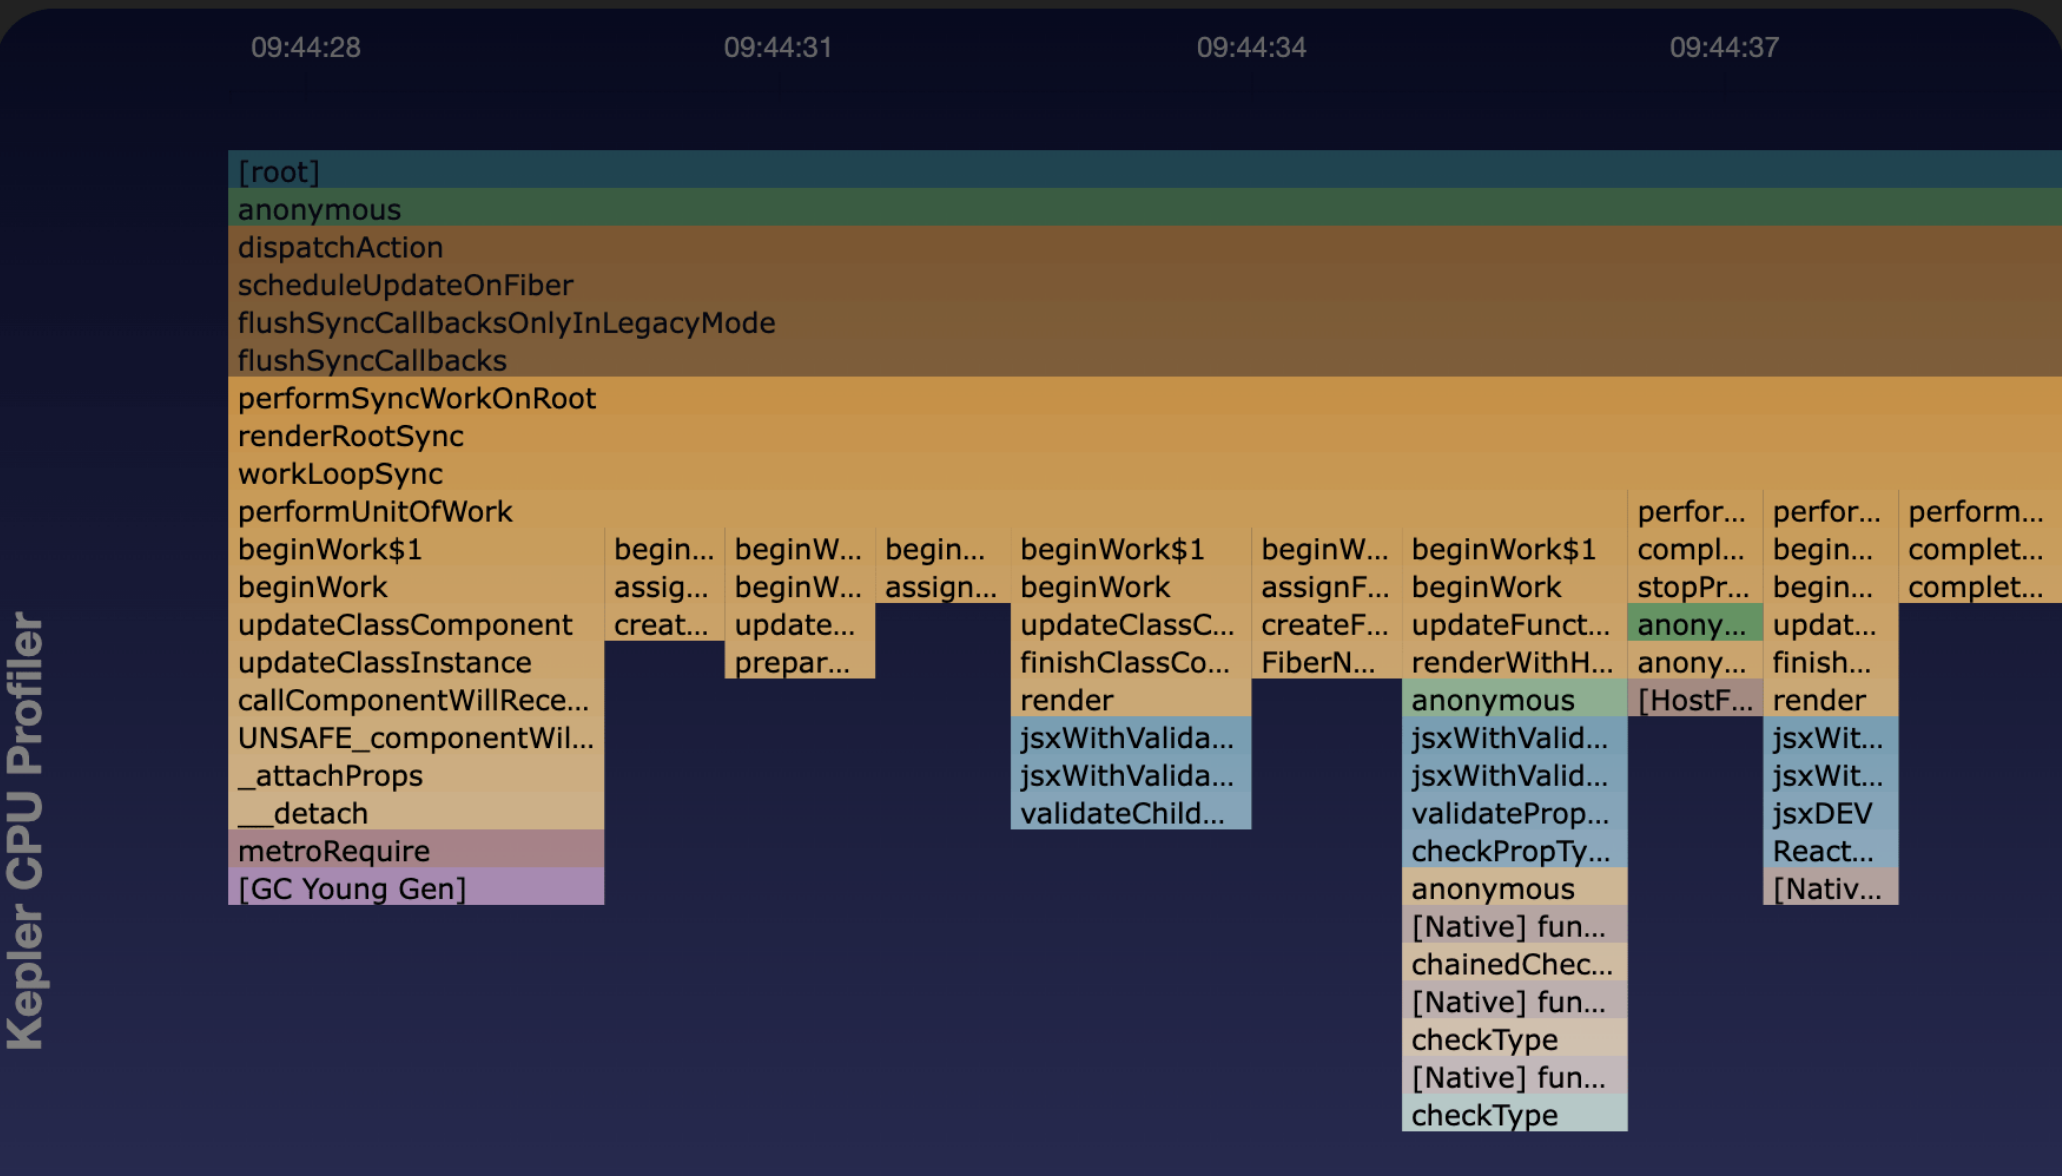
查看常用函数和火焰图
在Recording中打开记录的文件。
下图显示了CPU分析记录示例。
在性能命令行界面 (CLI) 中使用Vega CPU分析器
在开始记录会话之前,为Activity Monitor或Record命令提供--record-cpu-profiling和--source-map-file-path参数。
示例:
vega exec perf activity-monitor
            --record-cpu-profiling
            --app-name=com.amazondeveloper.keplervideoapp
            --sourcemap-file-path=<Kepler构建目录中的JS源映射文件路径>
JSON文件的内容包括CPU和内存利用率以及进程状态。
示例:
{
   "traceRecords": [
      {
         "startTs": 1687263185520361000,
         "endTs": 1687263201482227000,
         "traceName": "FOREGROUND",
         "pid": 2838,
         "timestamp": null,
         "processName": "com.amazondeveloper.keplervideoapp"
      },
      {
         "startTs": 1687263201482227000,
         "endTs": 1687263215311317000,
         "traceName": "BACKGROUND",
         "pid": 2838,
         "timestamp": null,
         "processName": "com.amazondeveloper.keplervideoapp"
      }
   ],
   "activityRecords": [
      {
         "timestamp": 1687263185024674256,
         "system": {
            "cpu": {
               "numCores": 4,
               "aggregated": {
                  "user": 147.6,
                  "sys": 114.8
               },
               "cores": []
            },
            "memory": {
               "total": 1807052.8,
               "free": 667648.0,
               "used": 502784.0,
               "available": 1252147.2
            }
         },
         "process": [
            {
               "pid": 2838,
               "name": "com.amazondeveloper.keplervideoapp",
               "cpuPercentage": 130.0,
               "memPercentage": 3.8,
               "memRES": 68456.0
            }
         ]
      }
   ],
   "cpuRecords": [{
        "hotFunctions": [{
                "function_name": "GradientOverlay",
                "file_path": "/VegaVideoApp/src/components/miniDetails/Preview.tsx",
                "line_number": 28,
                "column_number": 7,
                "begin_timestamp": 8407098854,
                "end_timestamp": 8408235415,
                "duration": 1136561,
                "percent_of_total": 16.08
            },
         ],
         "traceEventsFilePath": "/VegaVideoApp/generated/2024-01-10_09-52-13/trace1704909179877459917-converted.json"
   }]
}
这个JSON文件包含三个部分:
traceRecords
traceRecords使用以下属性记录生命周期阶段。
startTs(开始时间戳)endTs(结束时间戳)pid(进程ID)processName(应用名称)
activityRecords
activityRecords跟踪系统和进程上的Activity Monitor数据。
- 在系统上:
- CPU使用率(
sys和user),每个值最大为numCores乘以100 - 内存使用情况
- CPU使用率(
- 在进程上:
cpuPercentage(最大为numCores乘以100)memPercentage(内存百分比最高为100%)memRes(应用占用的共享内存总量)pid和app name(进程ID和名称)
cpuRecords
cpuRecords - 存储Vega CPU分析器中的常用函数。

应用会在记录结束后生成JSON文件并显示其位置。
火焰图
“火焰图”会显示系统活动和CPU消耗,从而帮助您发现潜在的瓶颈或效率低下的代码。每个函数节点的宽度显示其CPU消耗时间,包括在调用函数中花费的时间(非独占时间)。
非独占时间是运行函数所花费的时间,包括在此函数调用的所有函数上花费的时间。
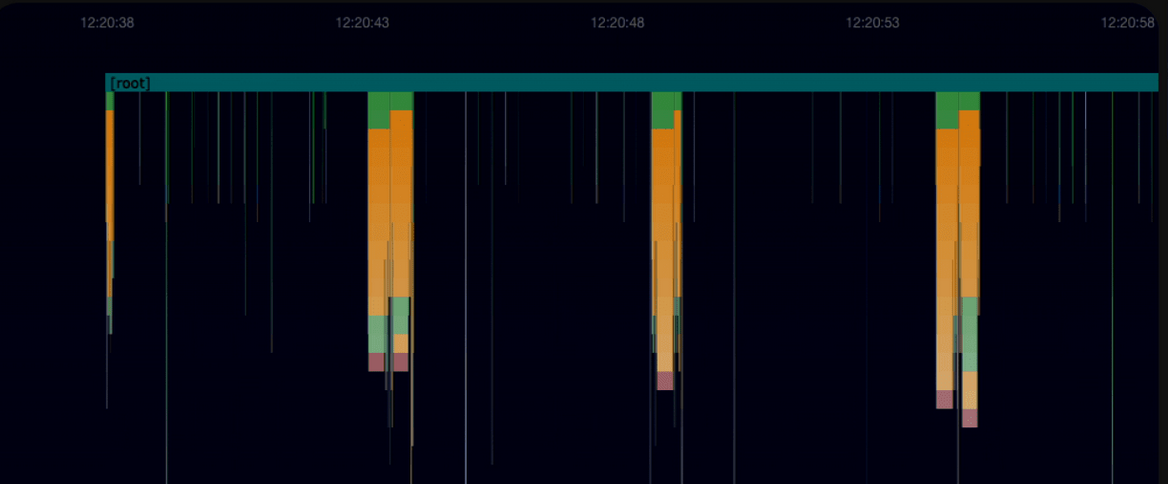
火焰图会显示三个关键元素:
- 记录期间正在运行的函数
- 每个函数的调用堆栈顺序
- 每个函数的大致运行时间
使用键盘上的箭头键或a-s-d-w键来浏览火焰图。
通过分析火焰图,您可以确定可能受益于优化的函数或代码路径。节点越宽表示所用的时间越多,这样您就可以有效地确定优化工作的优先顺序。
关于根据颜色确定函数源的指南
使用以下颜色代码指南表来帮助您确定函数或代码路径的来源。
| 路径 | 代码 | 类别 |
|---|---|---|
| @amzn | #ff9900 | 亚马逊橙色 |
| schedule | #008000 | 深绿色 |
| Native | #a0522d | 棕色 |
| react | #087EA4 | React蓝 |
| @react-native | #087EA4 | React蓝 |
| root | #008080 | 蓝绿色 |
| JavaScript | #4CAF50 | 浅绿色(您自己的代码) |
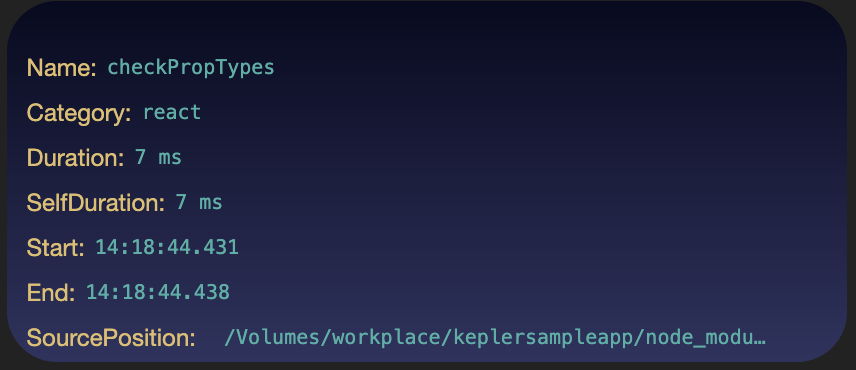
如果您将鼠标悬停在函数节点上,则火焰图将显示该函数的属性:
-
Name(名称)- 函数名称。
-
Category(类别)- 该函数所属的类别。
-
Duration(时长)- 应用执行此函数及其调用的所有其他子函数所花费的大致时间(以ms为单位)。
-
SelfDuration(自身时长)- 应用执行此函数所花费的大致时间(以ms为单位),不包括在子函数上花费的时间。
-
Start(开始时间)- 函数的开始时间戳。
-
End(结束时间)- 函数的结束时间戳。
-
SourcePosition - 带有函数名称、行号和列号的源位置。
单击
SourcePosition(源位置)即可查看项目中的函数源代码。
调用树
“调用树”显示了分析期间函数调用的层次结构,并在顶部列出了最耗时的函数。
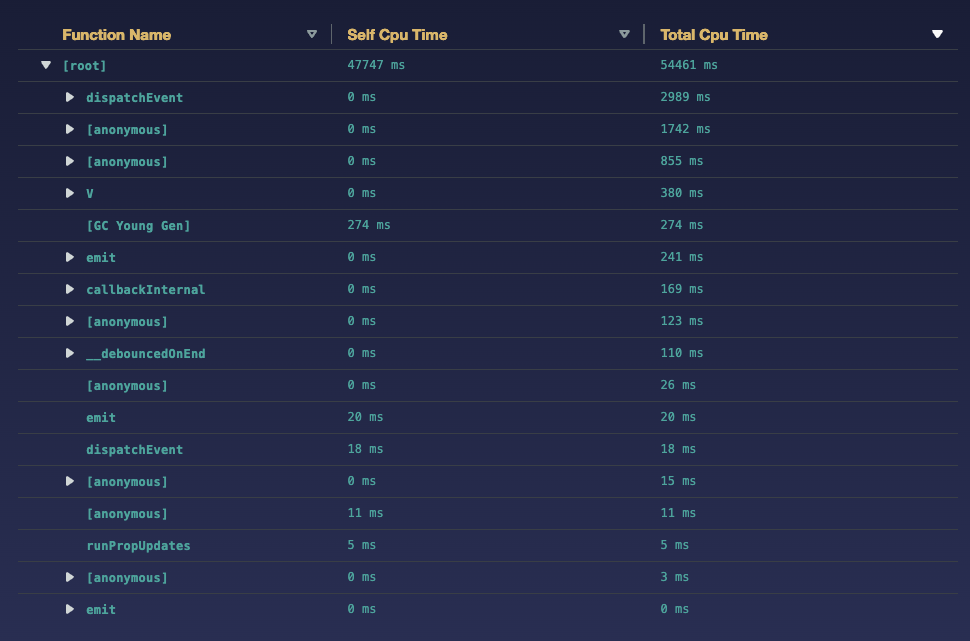
这个网格会显示以下内容:
Function Name(函数名称)- 函数名称和源位置。单击该链接查看源代码。
Total CPU Time(总计CPU时间)- 在每个函数上花费的总时间(非独占),以毫秒 (ms) 为单位,包括在所有子函数上花费的时间。
Self CPU Time(自身CPU时间)- 在每个函数上花费的总时间(独占),以毫秒 (ms) 为单位,不包括在所有子函数上花费的时间。
借助调用树,您可以执行以下任务:
- 展开和折叠节点,以聚焦特定区域。
- 按Self CPU Time或Total CPU Time排序。
打开之前的记录会话
使用以下方法之一。
选项1(首选): 使用快速打开
此方法可通过VS Code的界面或CLI访问您的记录。
在VS Code中
- 从Activity Monitor查找记录文件(示例:
Basic-Trace-Recorder[时间戳].json),该操作使用的是VS Code快速打开,或在项目generated目录中进行。 - 单击文件一次进行预览,或单击两次以活动模式打开。
在CLI中
-
打开终端窗口并输入:
code <<记录文件路径>> -
在VS Code中打开命令面板。
Mac: Shift+Command ⌘+P
Linux: Ctrl+Shift+P
如果您的终端无法识别Code命令:
- 打开VS Code。
-
打开命令面板:
Mac: Shift+Command ⌘+P
Linux: Ctrl+Shift+P
- 运行“Shell Command: Install code command in PATH”。
- 重试该命令。
选项2: 使用VS Code命令面板
此方法可让您使用VS Code的内置命令界面或在快速打开不可用时访问您的记录。
- 打开VS Code。
-
打开命令面板:
Mac: Shift+Command ⌘+P
Linux: Ctrl+Shift+P
- 输入Vega: Open Recording View。
-
从列表中选择之前的记录会话。
会话的Recording View在新窗口中打开。如果您在另一个选项卡中有进行中的会话,则焦点会转移到新会话。
相关主题
Last updated: 2026年5月7日